Skip to main content
Get the most out of your Google Analytics
If you are anything like me, you know the importance of analytics, but they tend to get overlooked. In this blog I will explain the practical steps I have taken to get the most out of my analytics and how you can do the same.
1 November 2023 9 min read

Introduction
Google analytics, if you have never used it before, is a free online tool that provides insights into how people use your website. It’s allows you to find out all sorts of useful data from the number of people engaging with your content to the type of device they use.
The problem with having access to so much data is deciding what is relevant and what is just noise.
Using GA4 and looker studio
My first suggestion for getting the most out of your analytics is setting up regular email reports. If you don’t set up reports, it is unlikely that you will remember to regularly check your data.
The older versions of analytics allowed you to set up email reports, unfortunately GA4 (the latest version of analytics) doesn’t support this feature. Fortunately google provides a secondary tool that allows us to set up reports - Looker Studio.
Setting up a basic report in Looker Studio
Follow this step by step guide to set up a monthly report:
1. To create your first report in Looker Studio (link) you will first need to set up a working Google Analytics (link) property (there are plenty of easy tutorials on YouTube.)
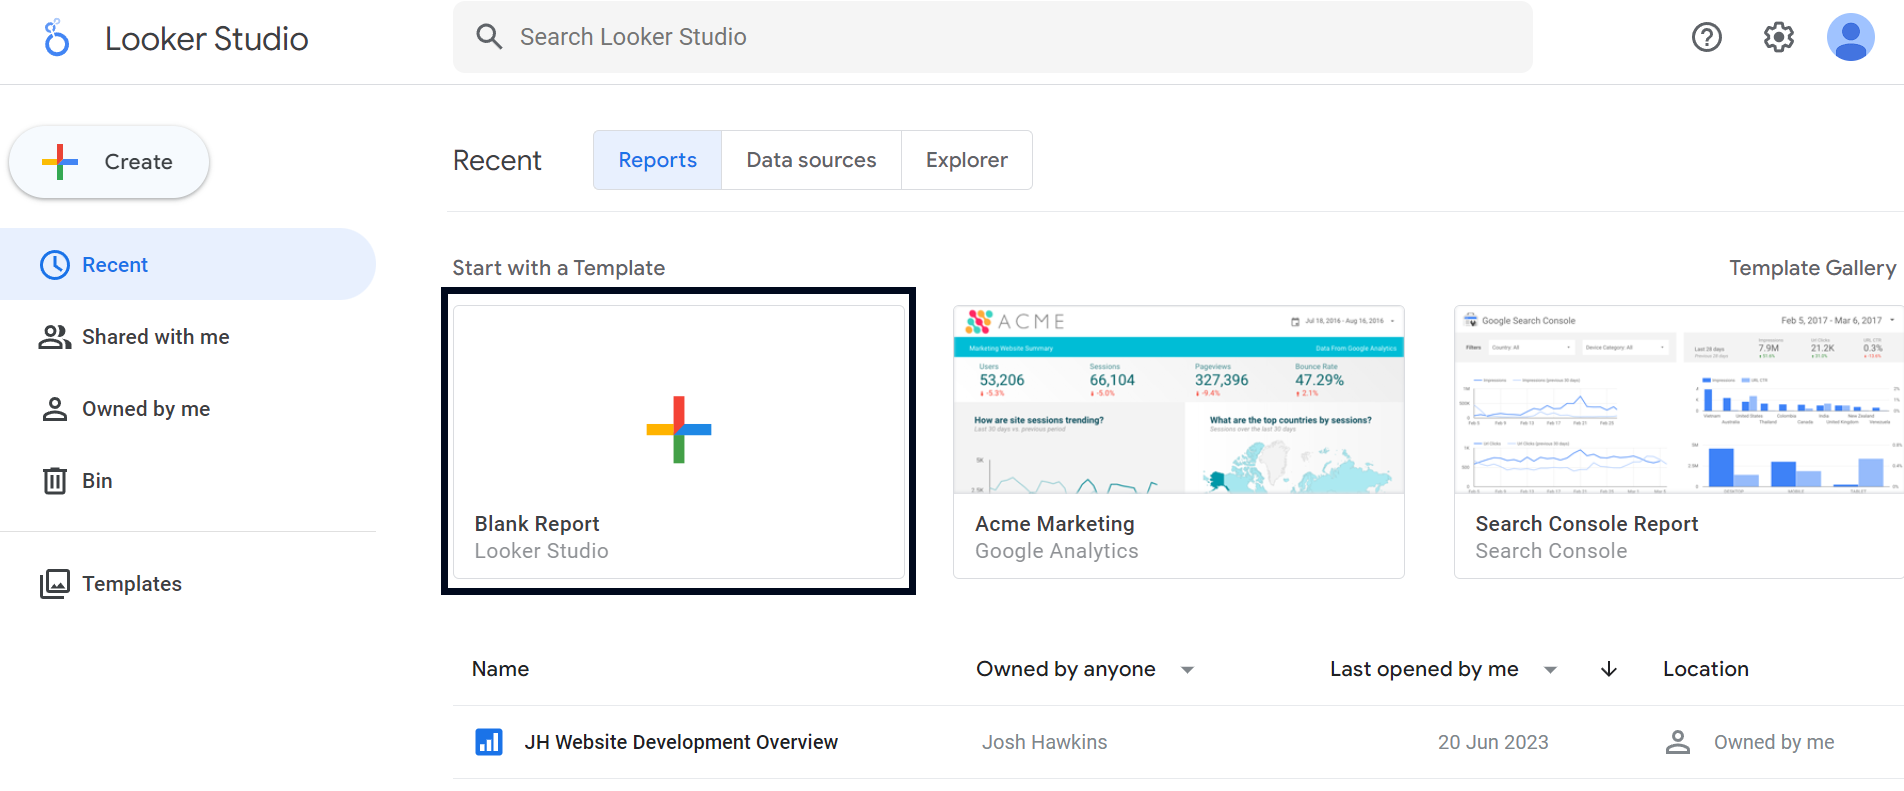
2. In Looker studio select blank report:
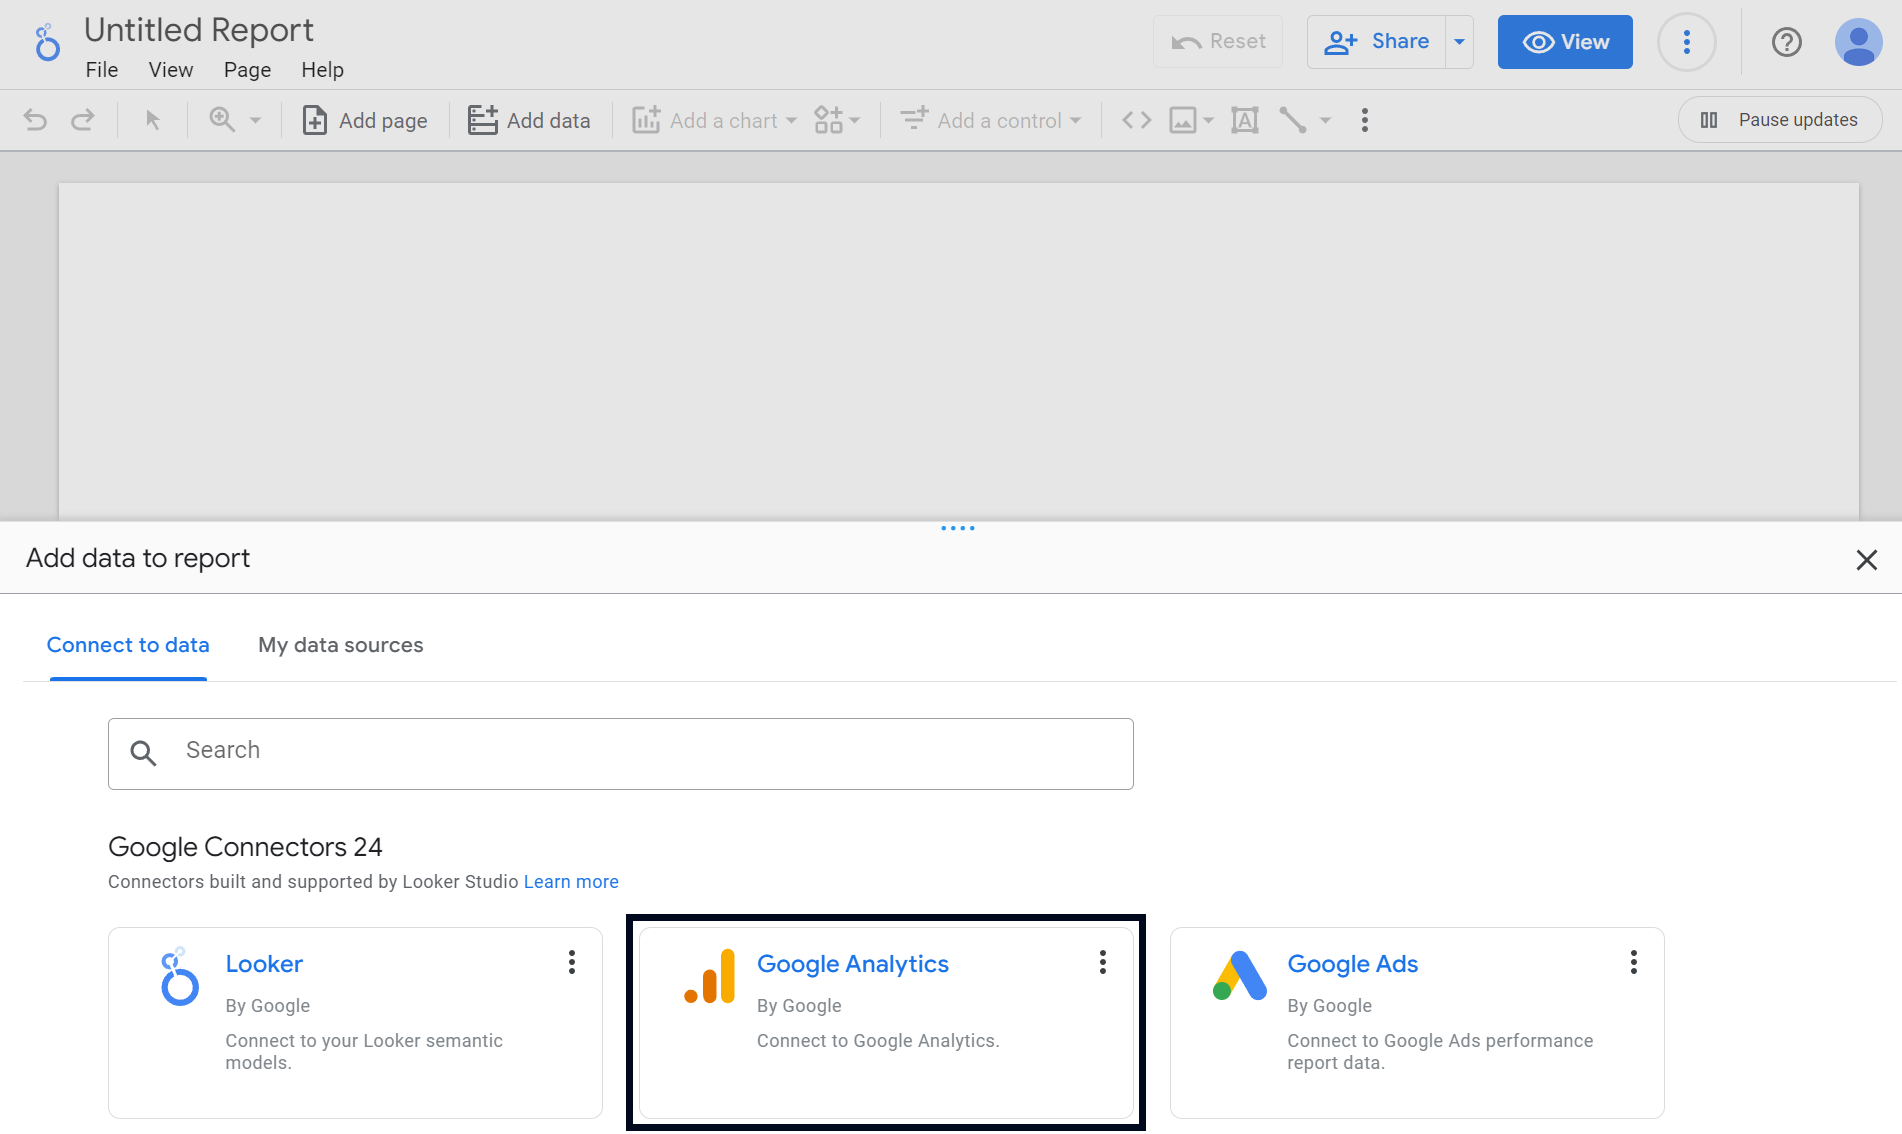
3. Then select Google Analytics:
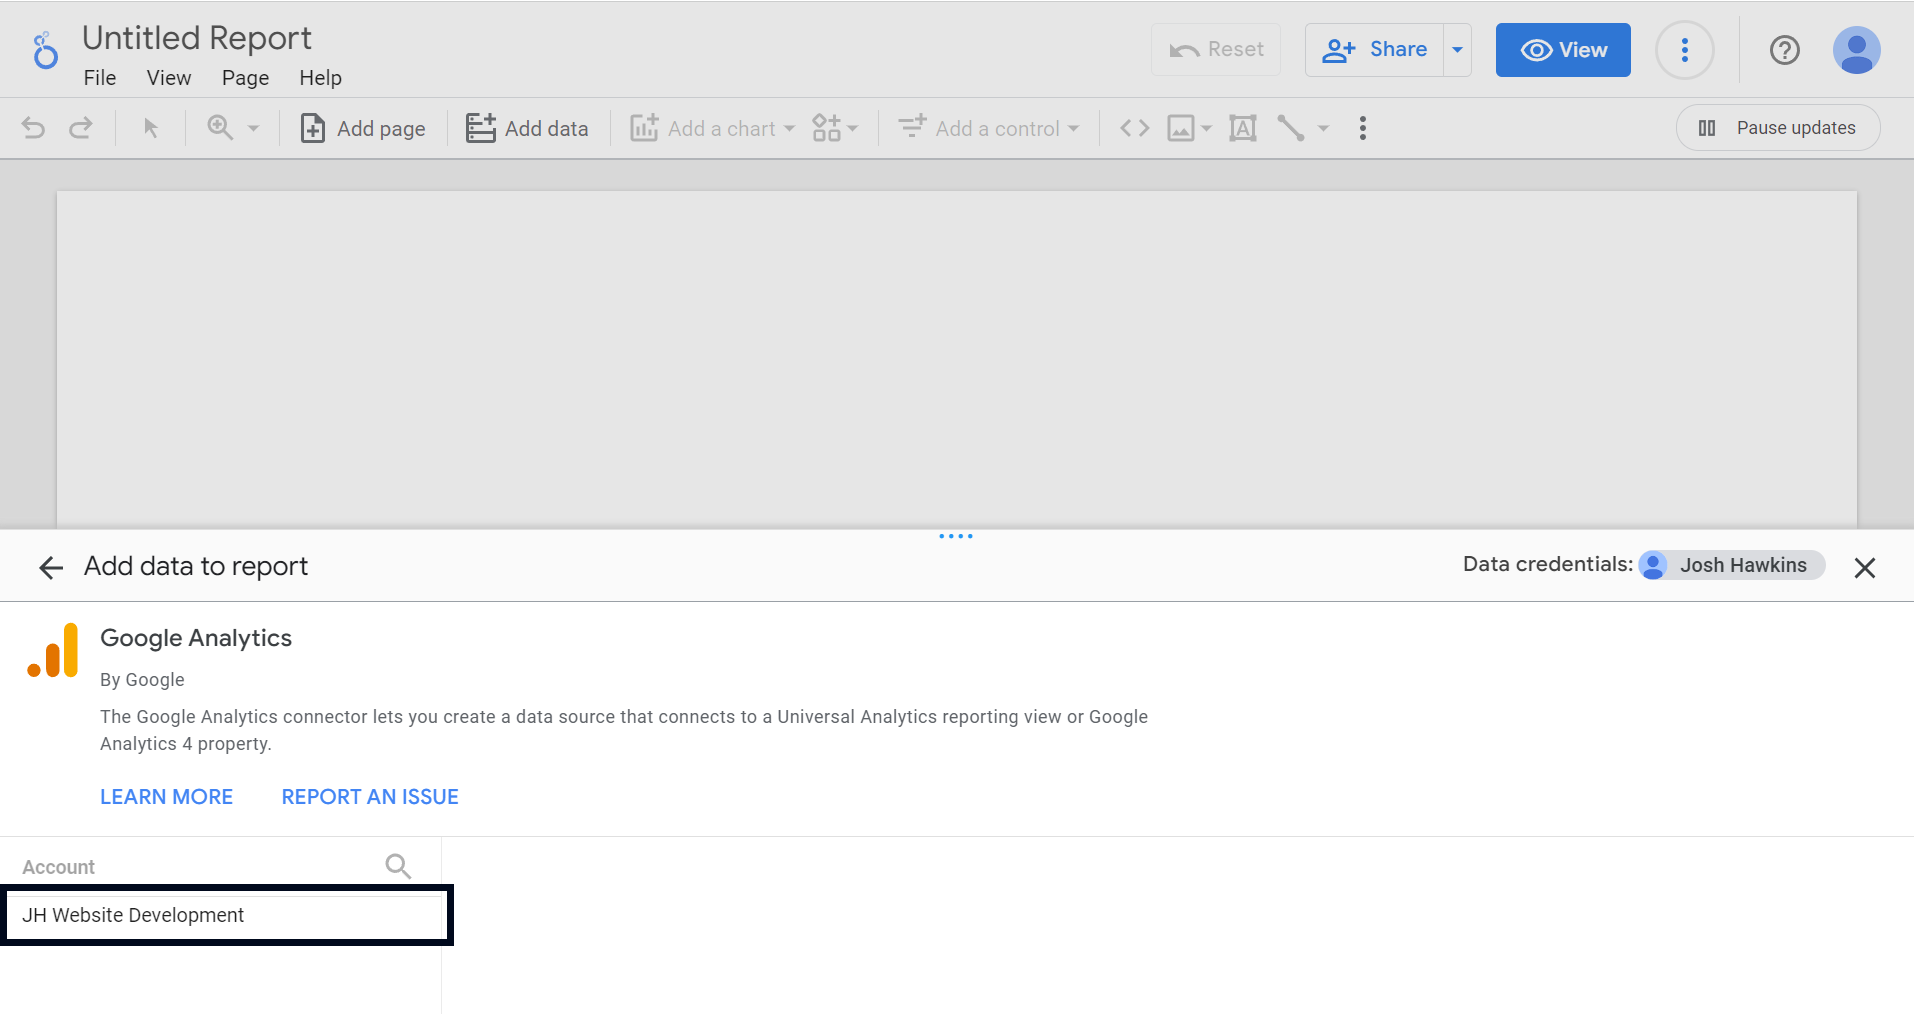
4. Choose which property you would like the report to collect data from, in this case it is my property for “JH Website Development.”
5. Add a table and a date selector to your report. Use the dimensions and metrics shown on the right-hand side of the below image.
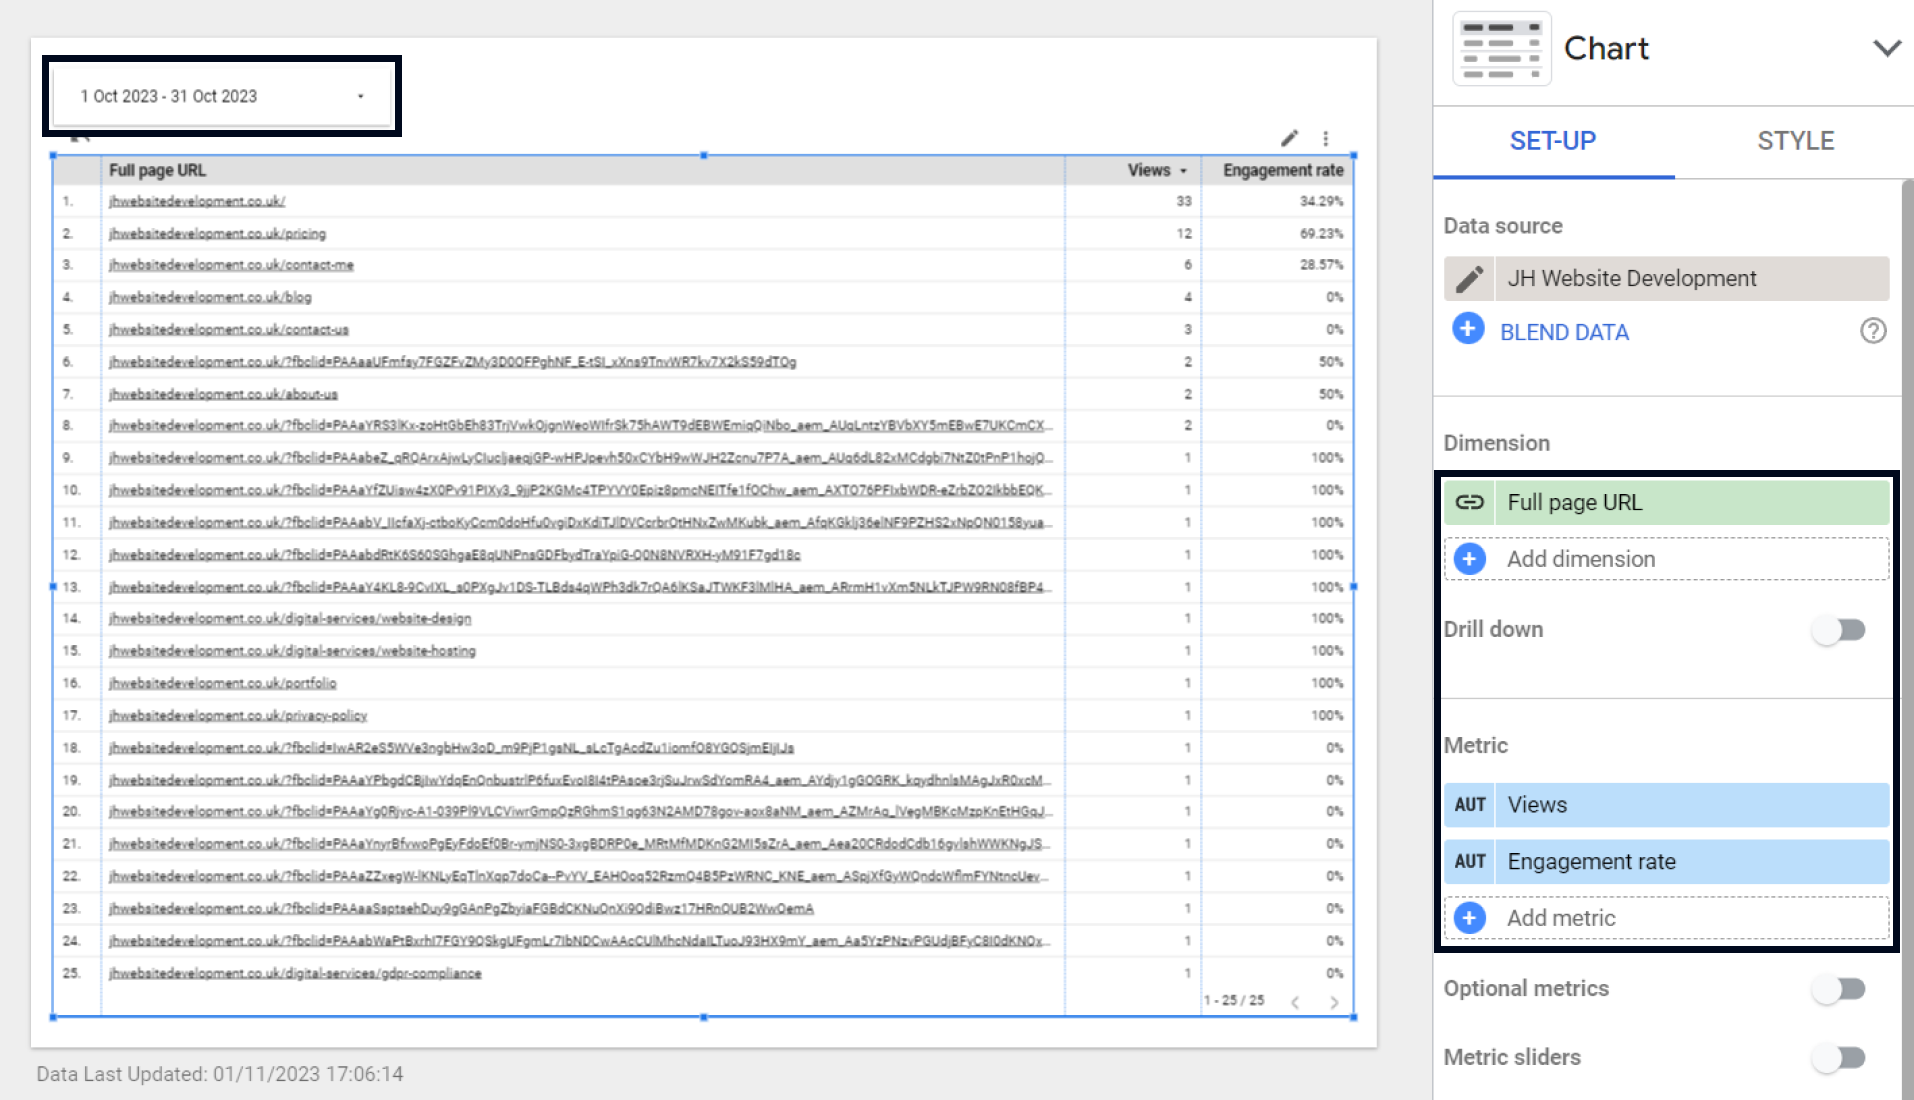
6. You now have a report set up to track the traffic and engagement of your website.
Understanding the data
The key metrics that I report on are views, sessions, users and engagement rate. These allow me to make educated assumptions on how users interact with my site and where I am losing customers.
To understand how well my content performs I focus on views and engagement rate:
- high views and high engagement rate = well performing page
- low views and high engagement rate = a well performing page that is difficult to find
- high views and low engagement rate = easy to find page but missing useful content
- low views and low engagement = could indicate outdated content that can be removed
Conclusion
By regularly reviewing your google analytics performance against these key findings will allow you to make informed decisions about your website content. By using these decisions to influence change it will lead to a lasting improvement in performance.